You opened Studio. Impressions are way down. CTR looks the same as it always does. This is one of the cleanest signatures YouTube hands you, and most creators read it wrong. When YouTube impressions dropped but CTR is fine, your packaging is working. The algorithm just stopped showing your video to as many people. Don't touch the thumbnail. Read this first.
What "impressions dropped but CTR is fine" actually means in Studio
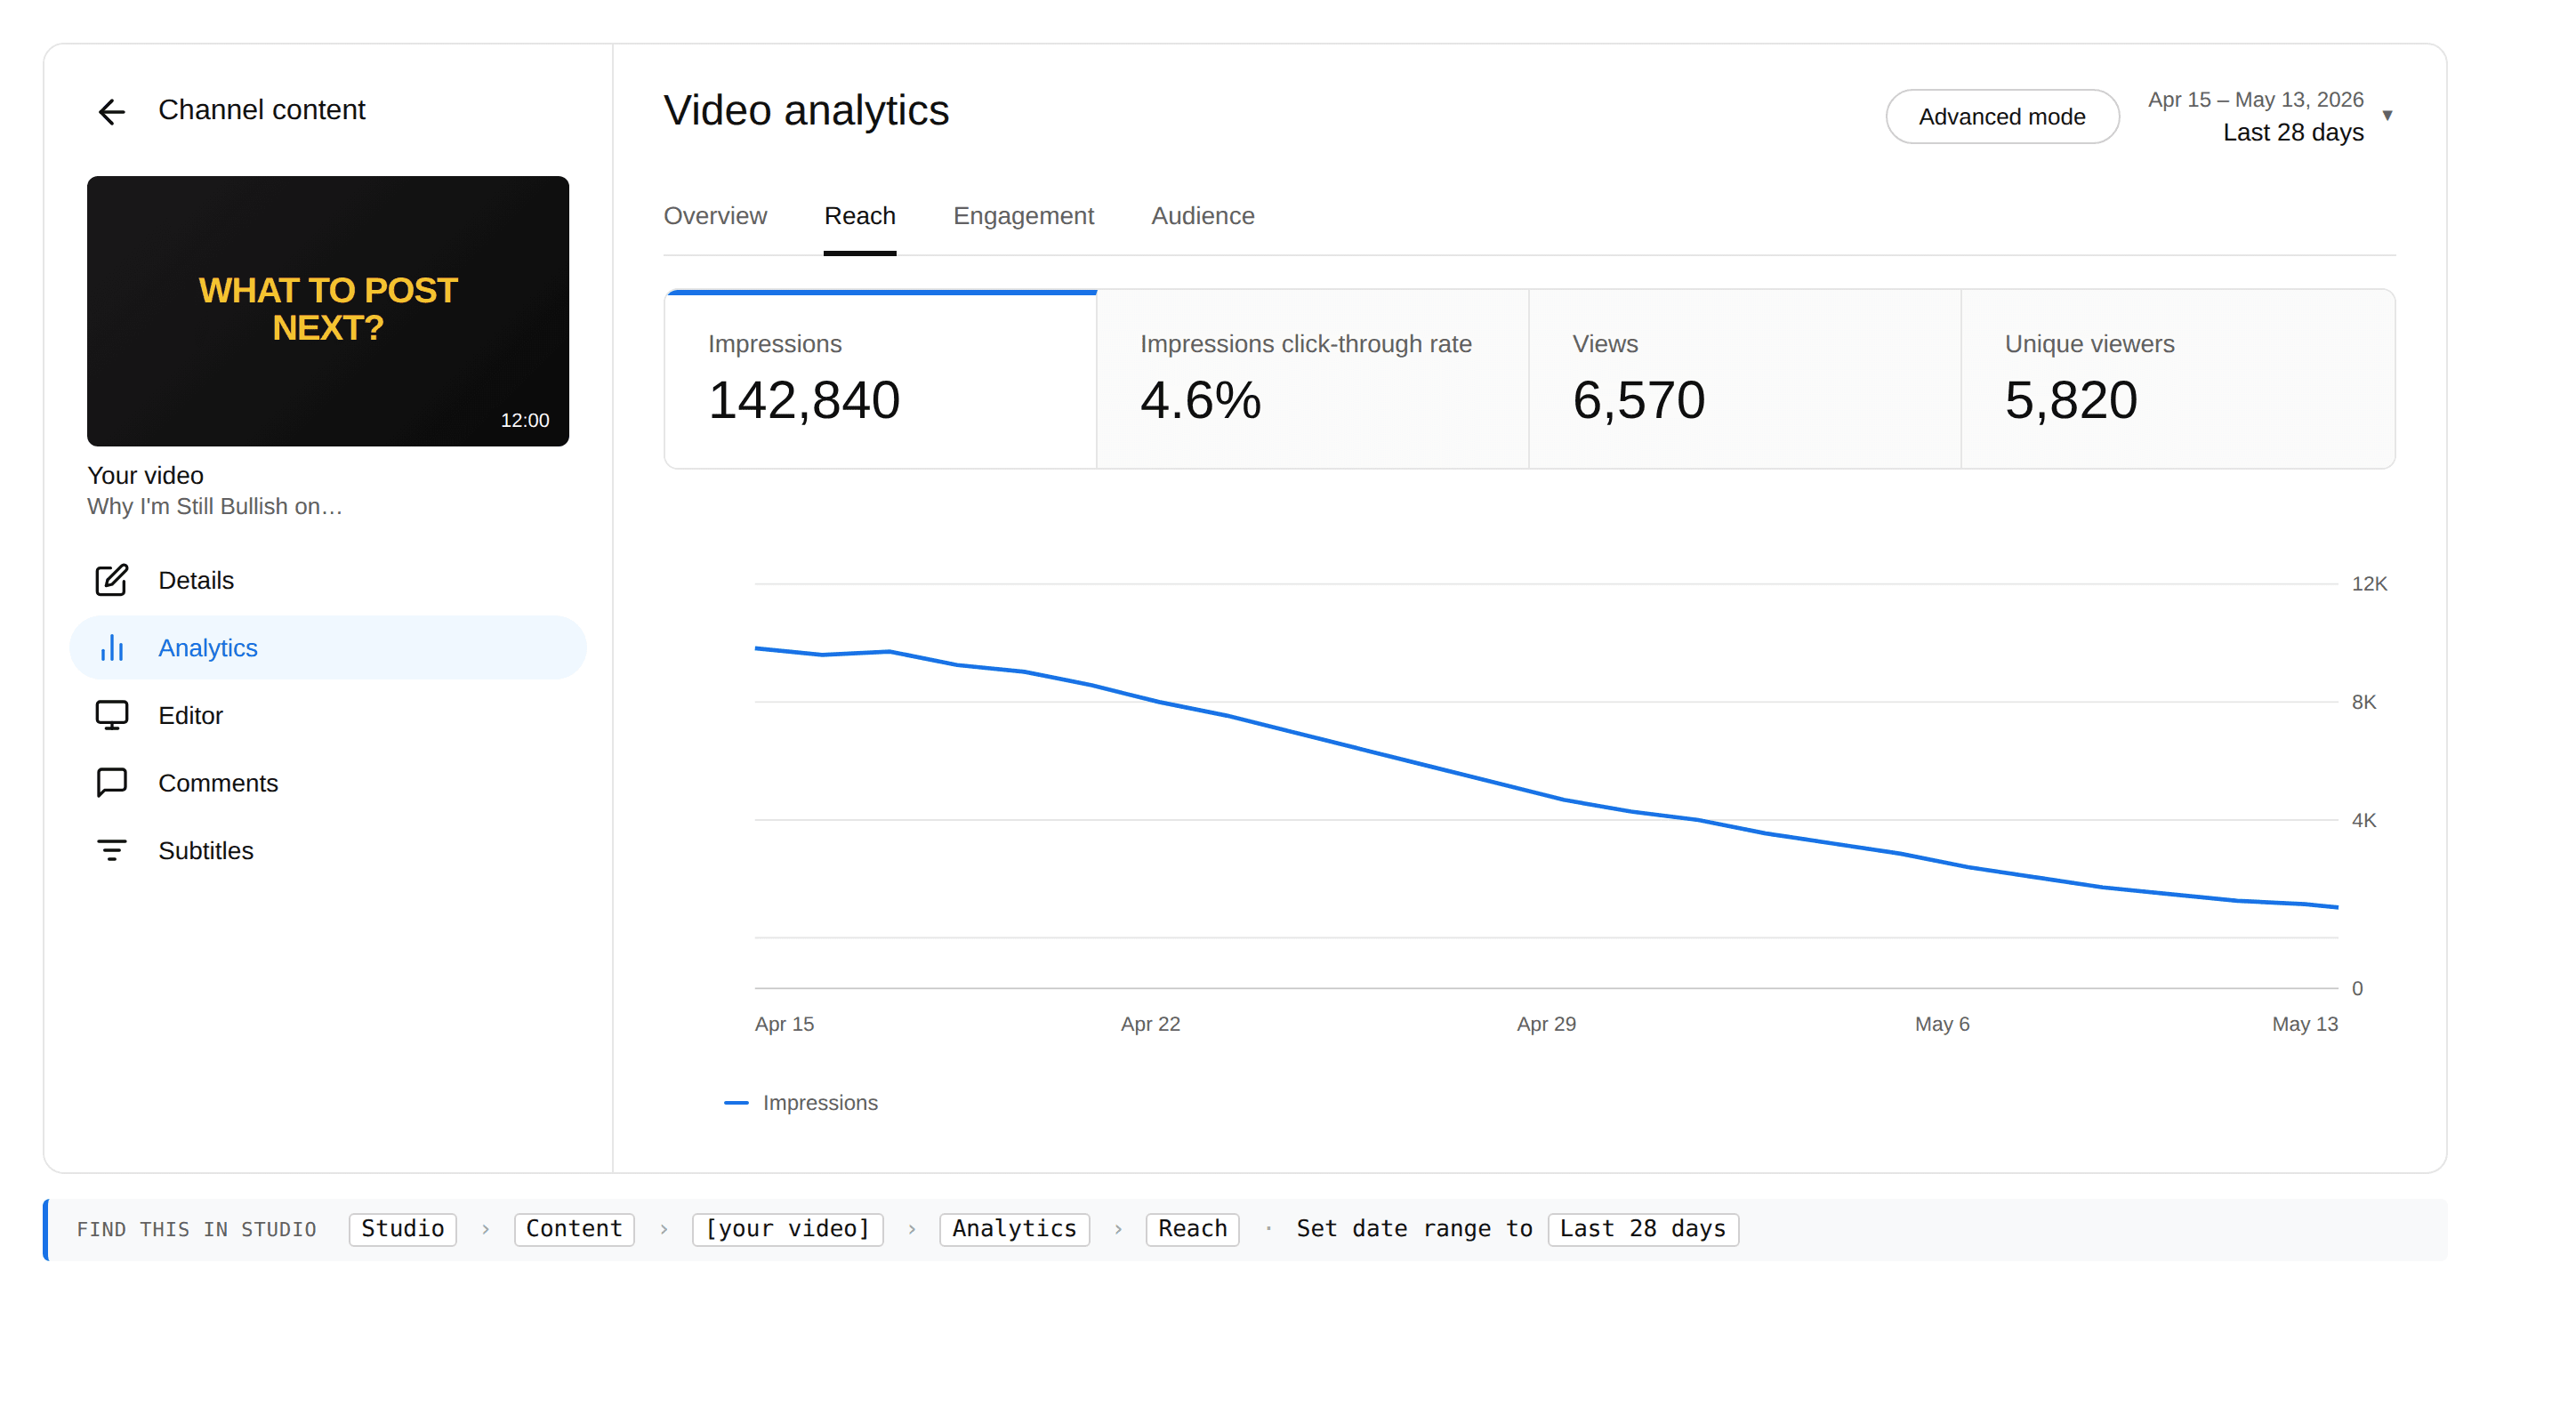
When impressions drop and CTR stays flat, the funnel narrowed at the top, not the bottom. YouTube decided to serve your video to fewer eyeballs. The eyeballs it did serve clicked at the rate they always do — which means your packaging works, and your target audience still recognizes the video as worth their time.
This is a distribution pullback. It usually comes from one of four causes. Your video didn't earn enough watch time on day 1–2 to keep getting pushed. A bigger creator published a similar video that week and ate your recommendation slot. The audience pool for this specific topic is small and you've already reached most of it. Or YouTube ran an internal ranking change that shifted weight off the surface carrying you.
Confirm you're not actually in Pattern 3
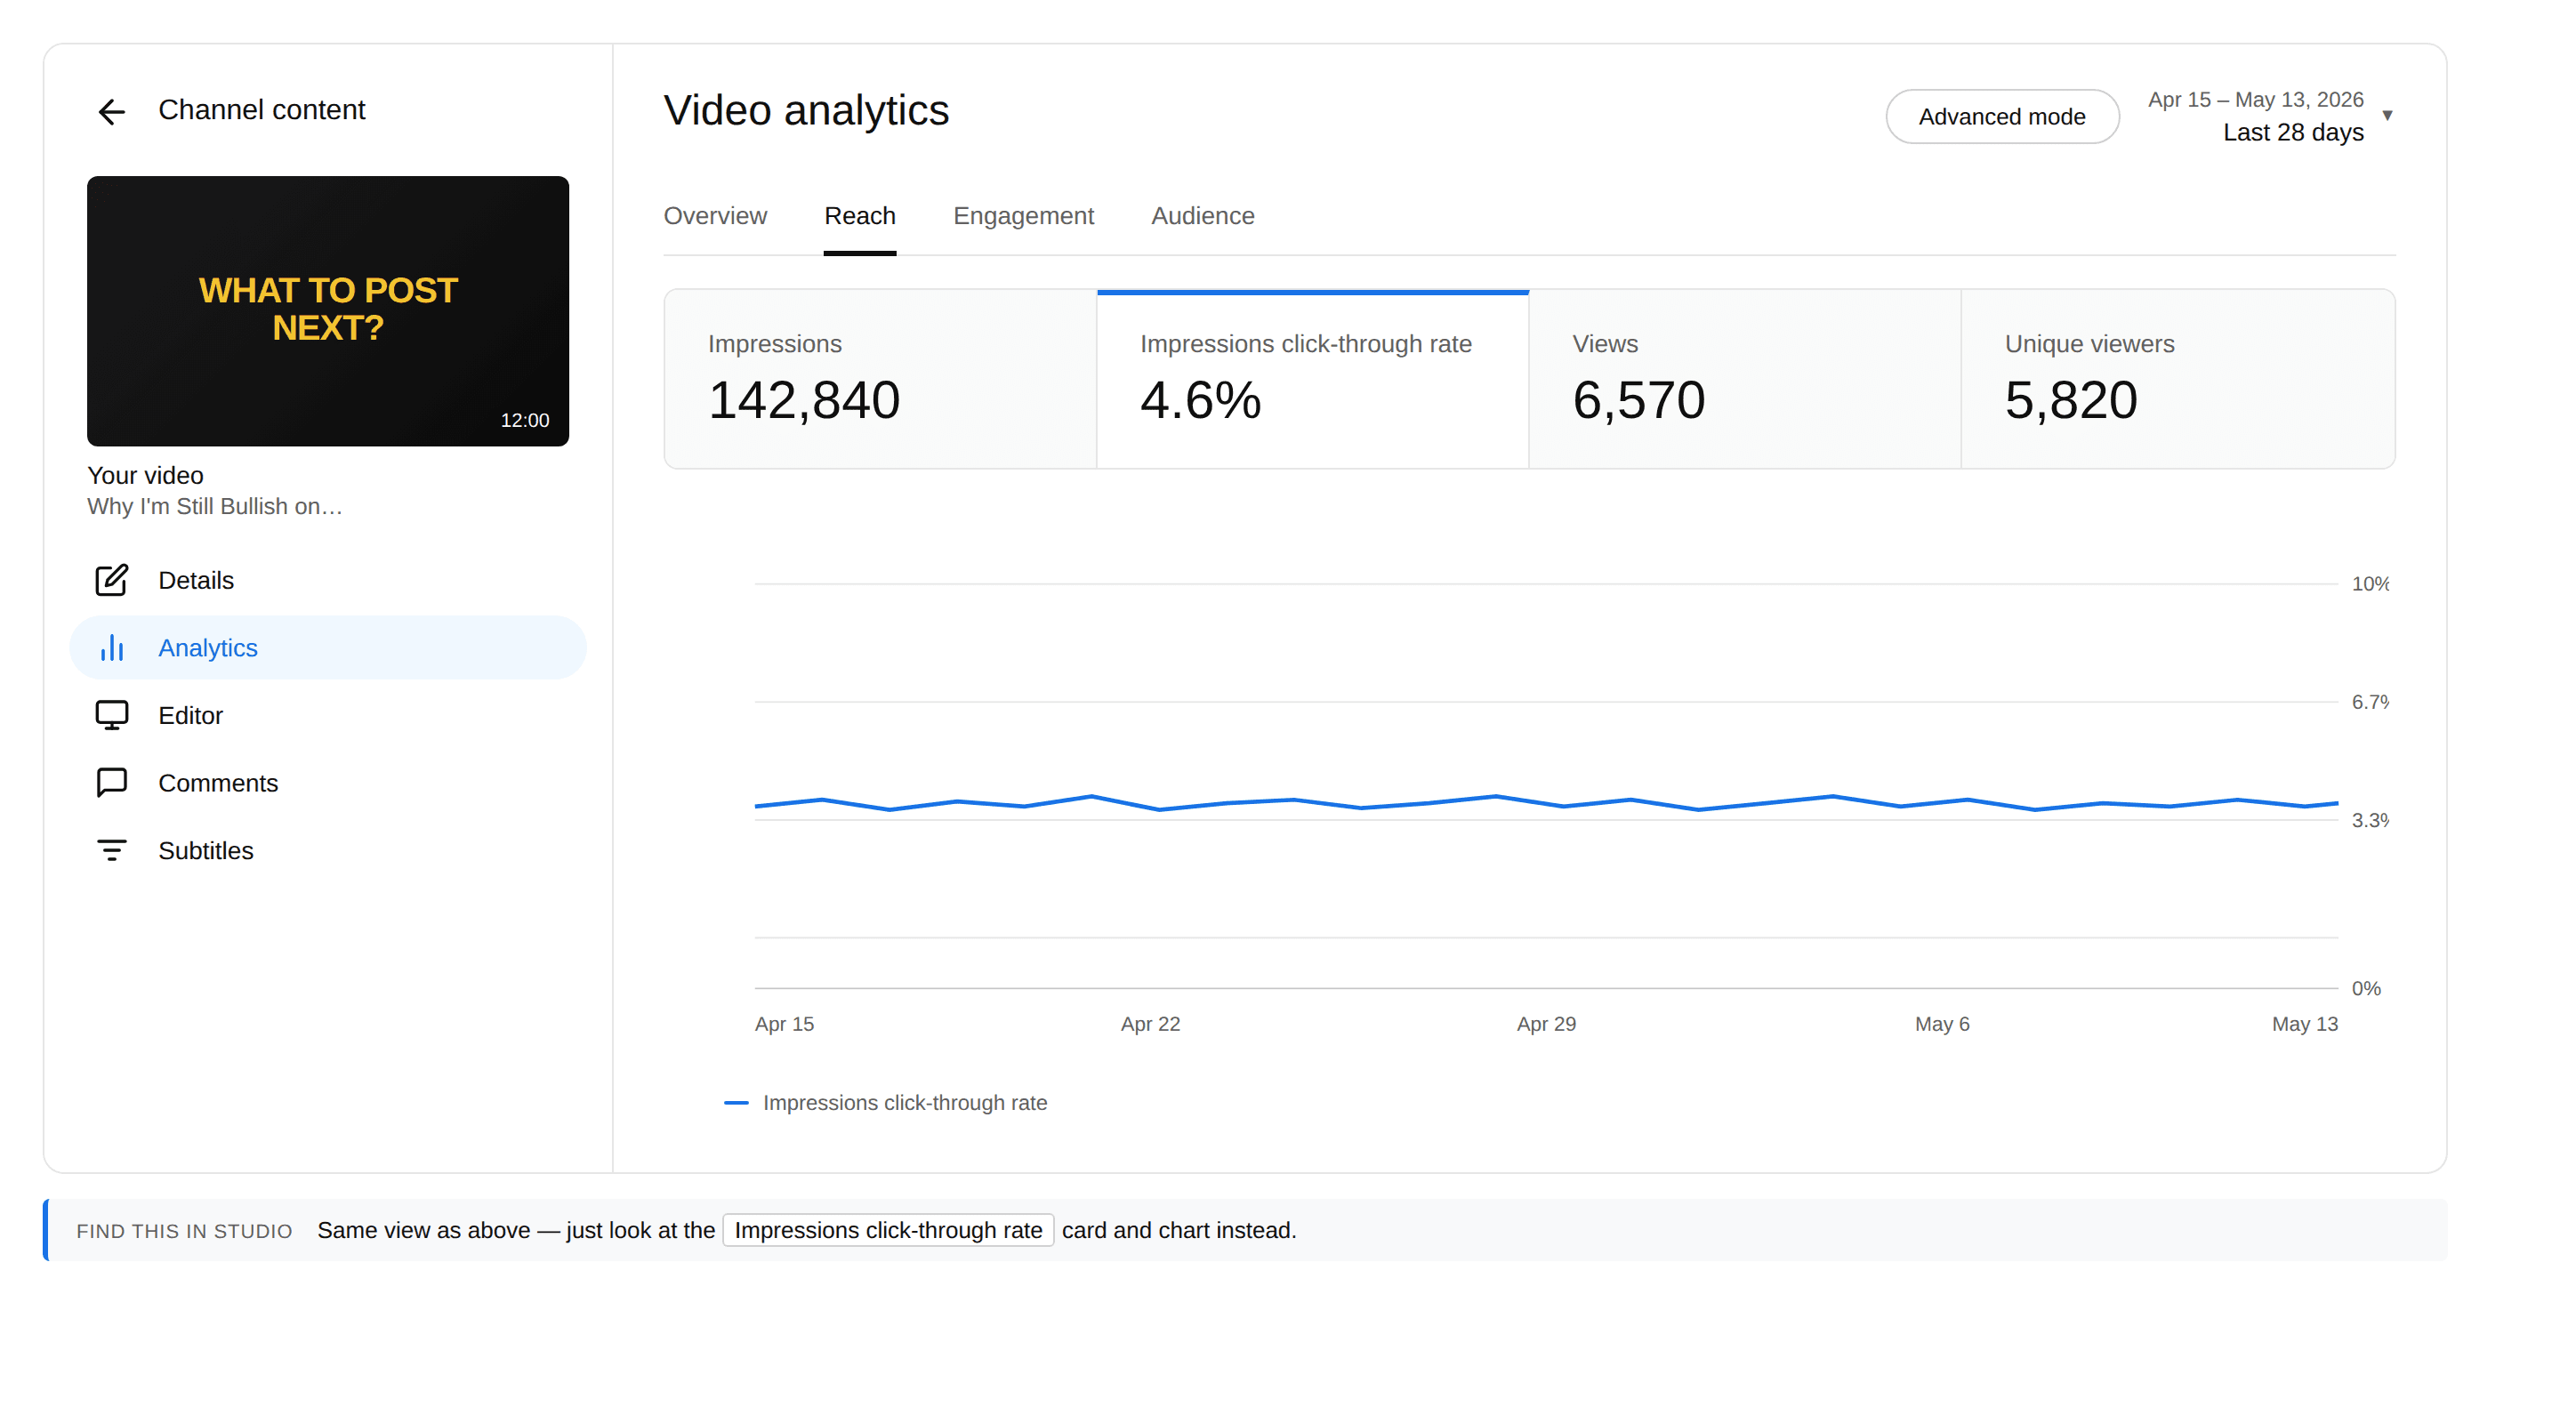
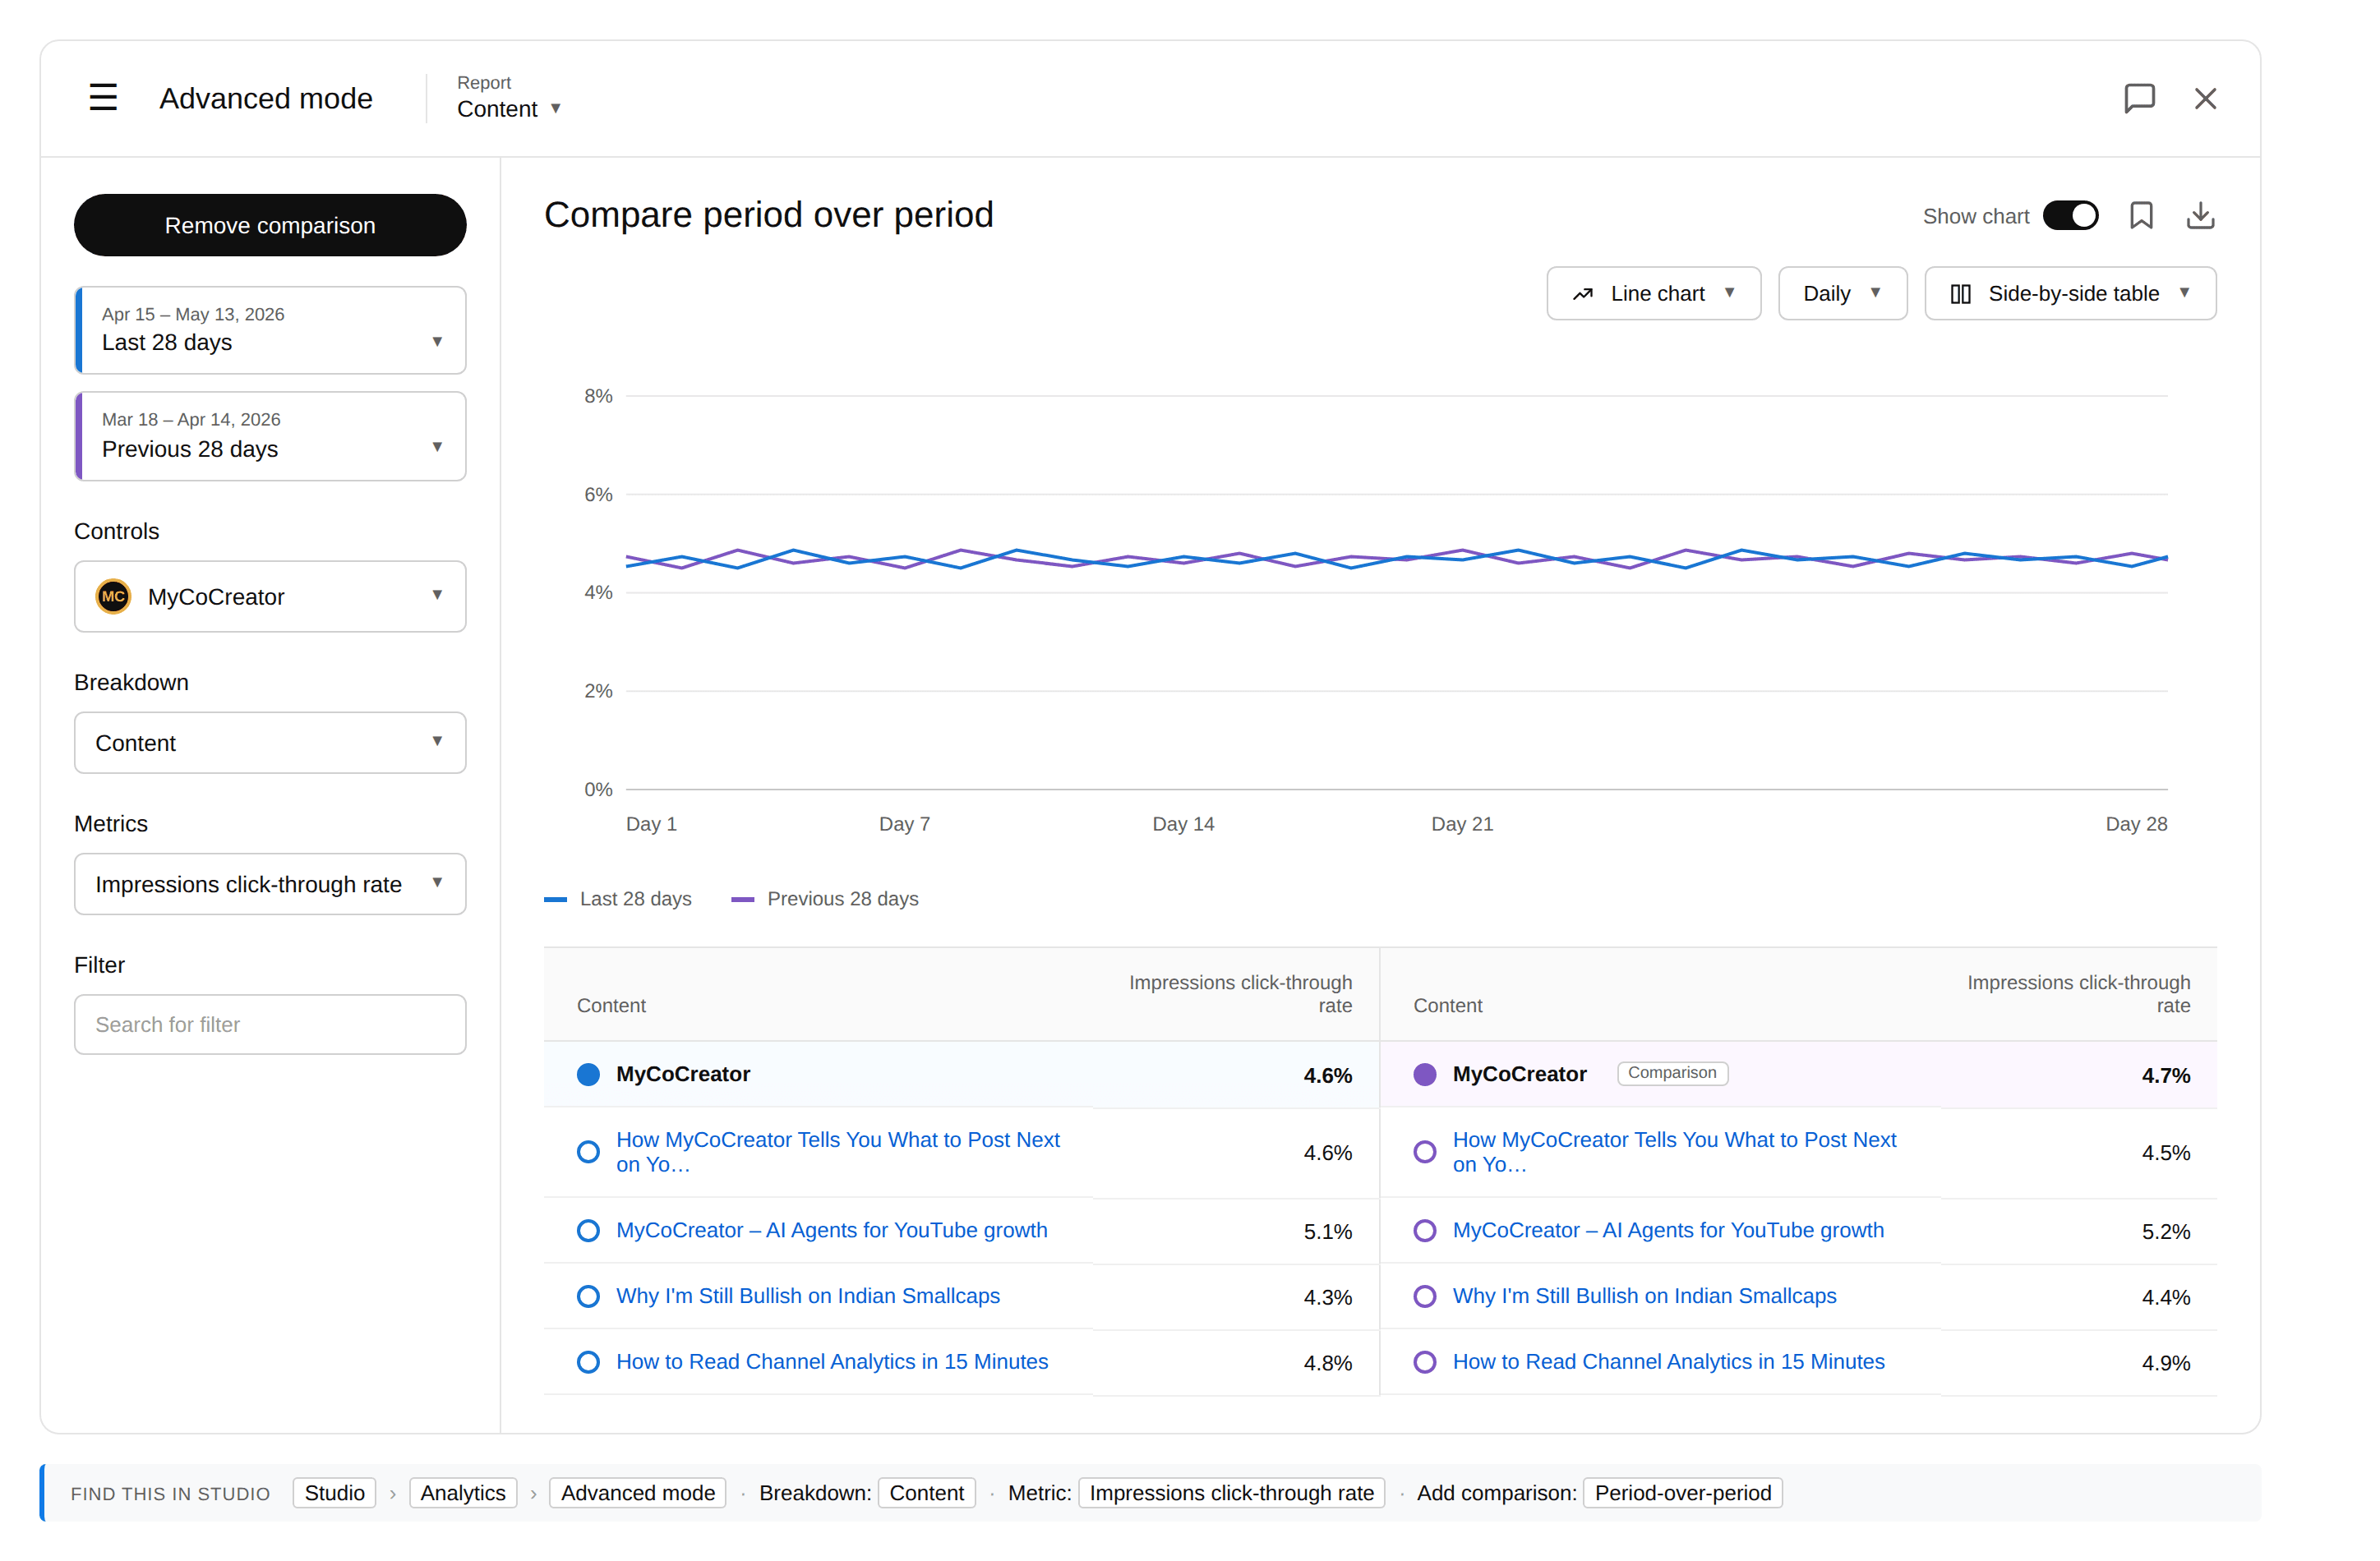
Pattern 3 looks similar at the top-line — fewer views — but the tell is whether CTR moved. As a rough rule of thumb: open the affected video's analytics and compare CTR for "Last 28 days" against "Previous 28 days." If CTR stayed close to its usual range, you're in Pattern 1. If CTR climbed noticeably, you're in Pattern 3, and the diagnosis is different. Read why CTR went up but views went down.
Also rule out the simpler case: did a recent video go viral and then revert? If yes, the "drop" is post-outlier reversion, not distribution pullback. Go back to how to read YouTube analytics when your views drop for that diagnosis.
Find the surface that lost the impressions
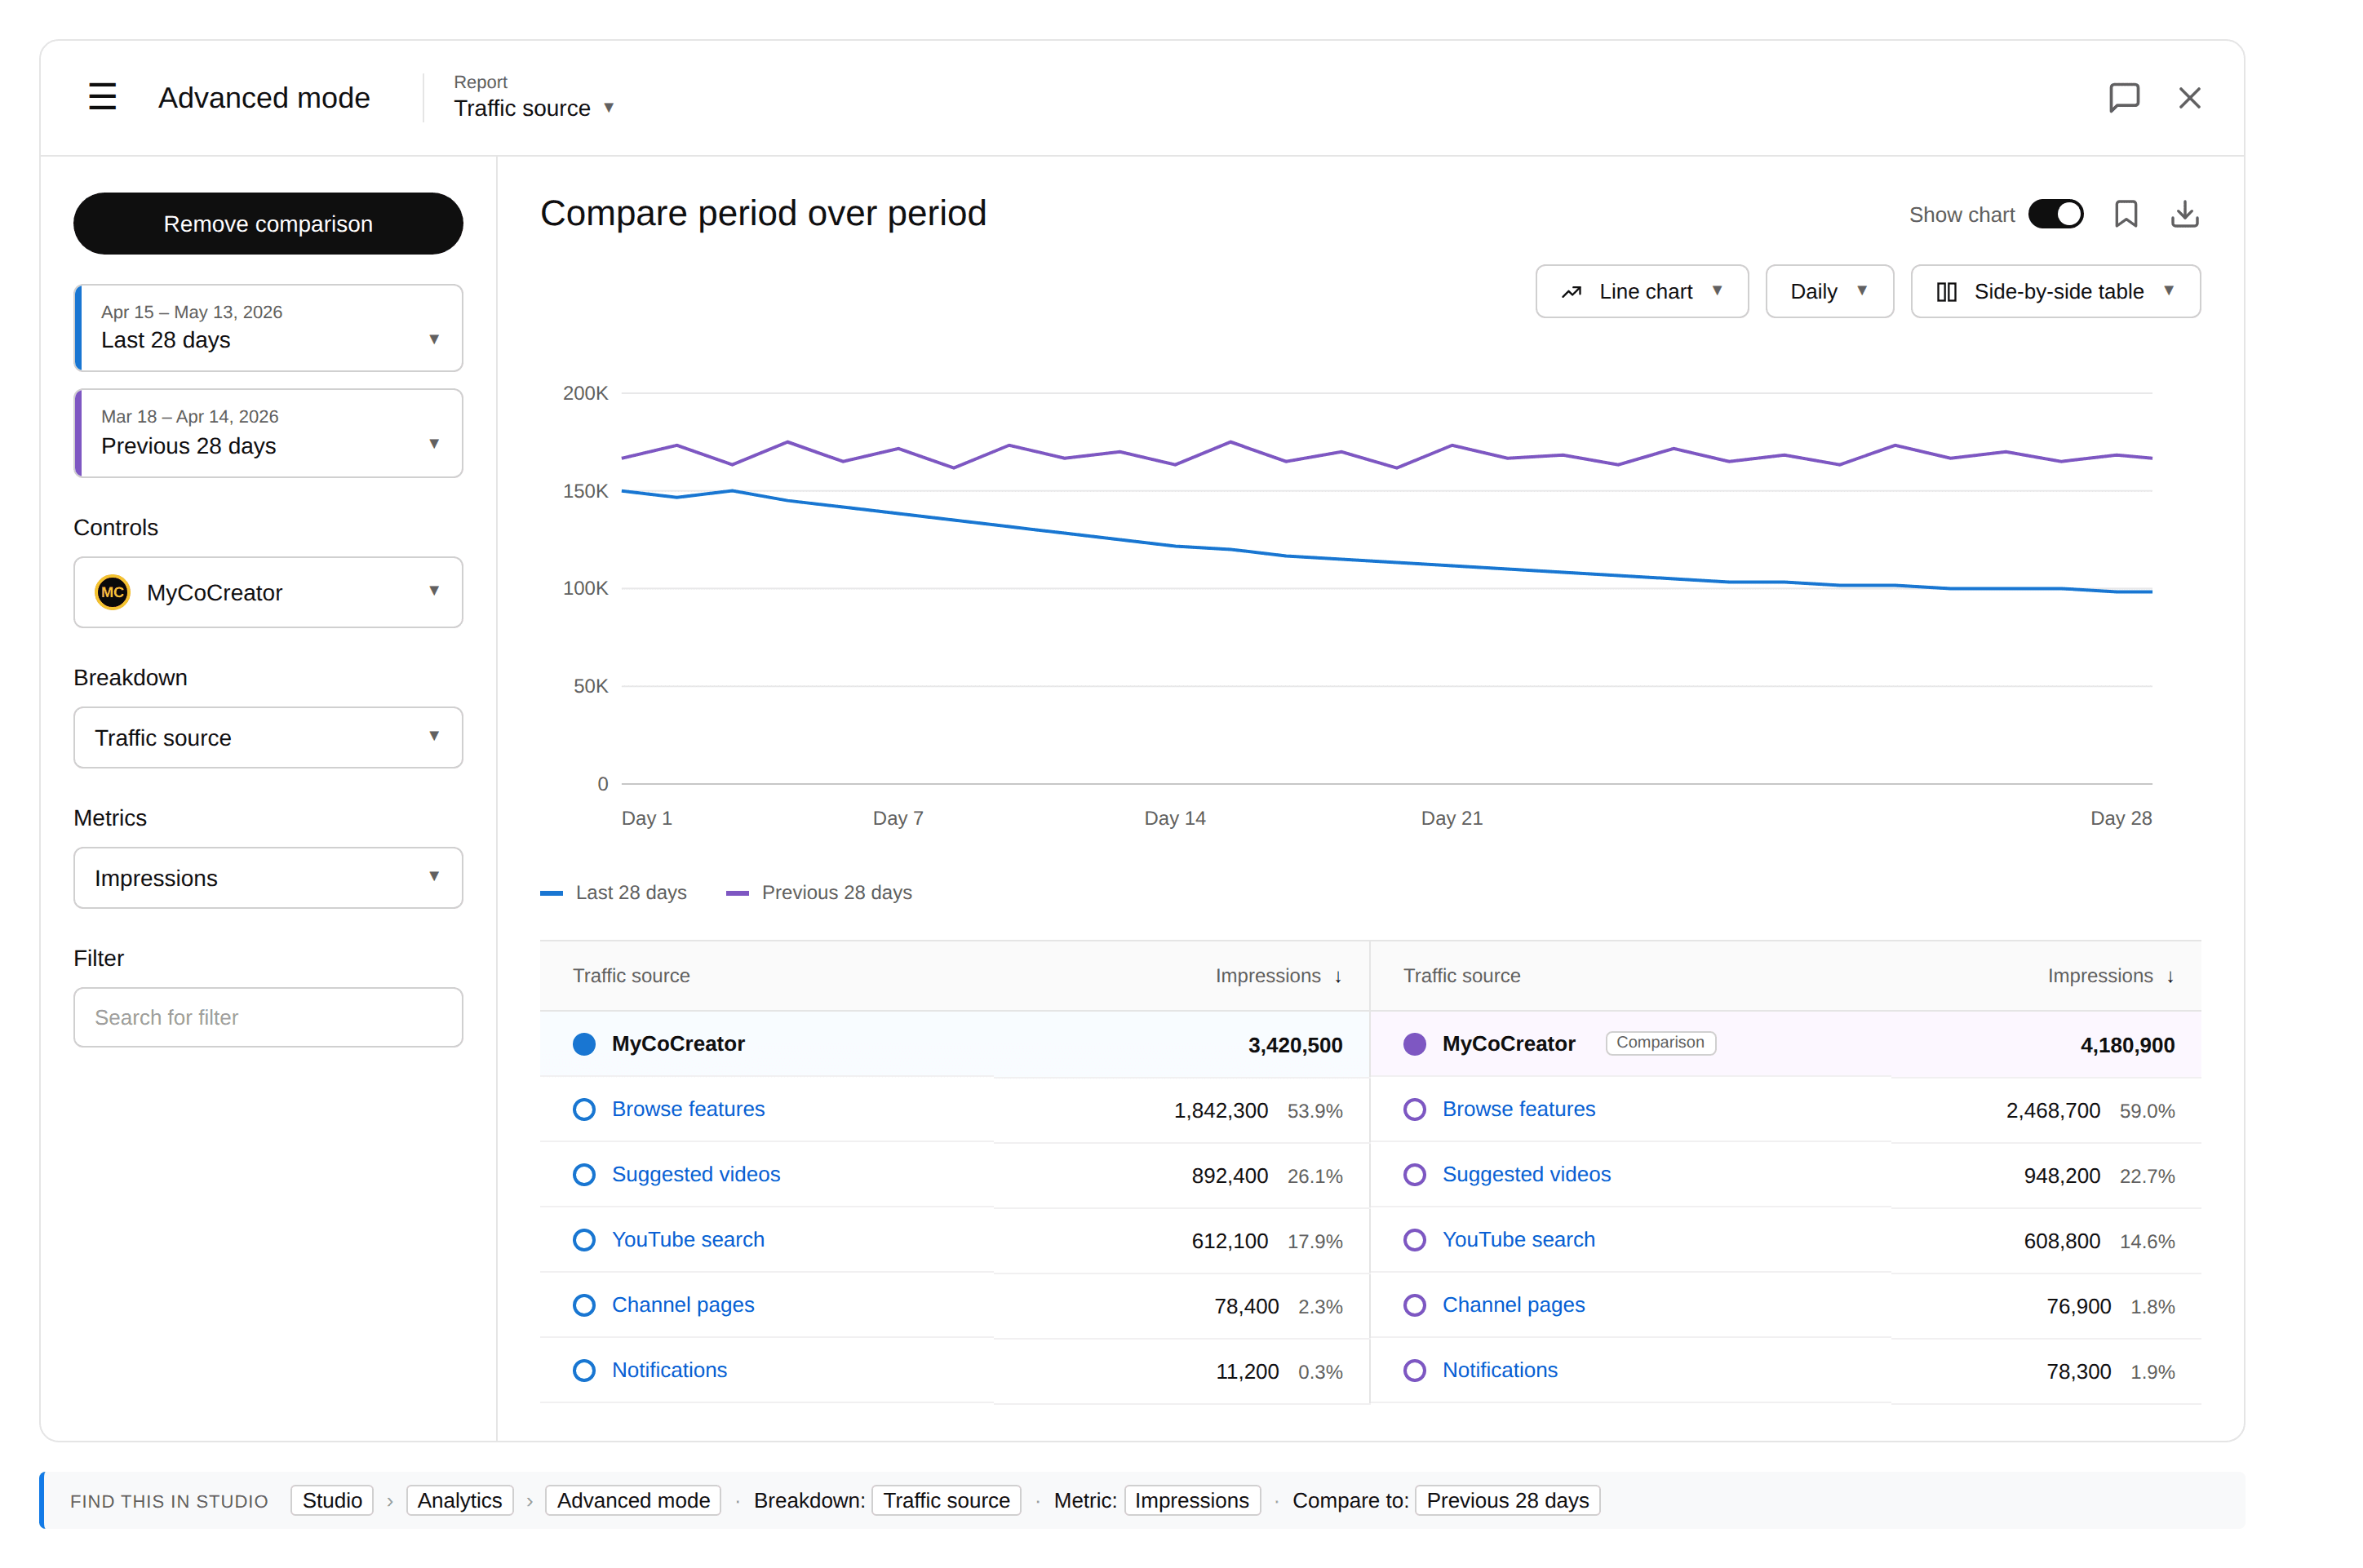
Distribution pullback is rarely uniform. The algorithm usually pulls back from one surface — Browse, Suggested, or Search — while the others hold steady. In Studio: Advanced Mode → set Report to "Traffic source" → set the Metric to "Impressions" → enable Compare period over period (Last 28 days vs Previous 28 days). Sort by absolute impression drop, not percentage.
Whichever surface lost the most impressions is the one the algorithm de-prioritized. The diagnosis skews different by surface. Browse pullback usually means your video isn't earning enough click-through on the homepage to keep its slot. Suggested pullback means the recommendation graph stopped associating you with the videos your viewers were already watching. Search pullback usually means a new competitor took the keyword, or your title shifted off the query.
If you're not sure which surface matters most, see browse vs suggested vs search traffic — which one failed.
One video, or the whole channel?
The next split: did one specific video lose impressions, or did your back catalog lose them too?
One video
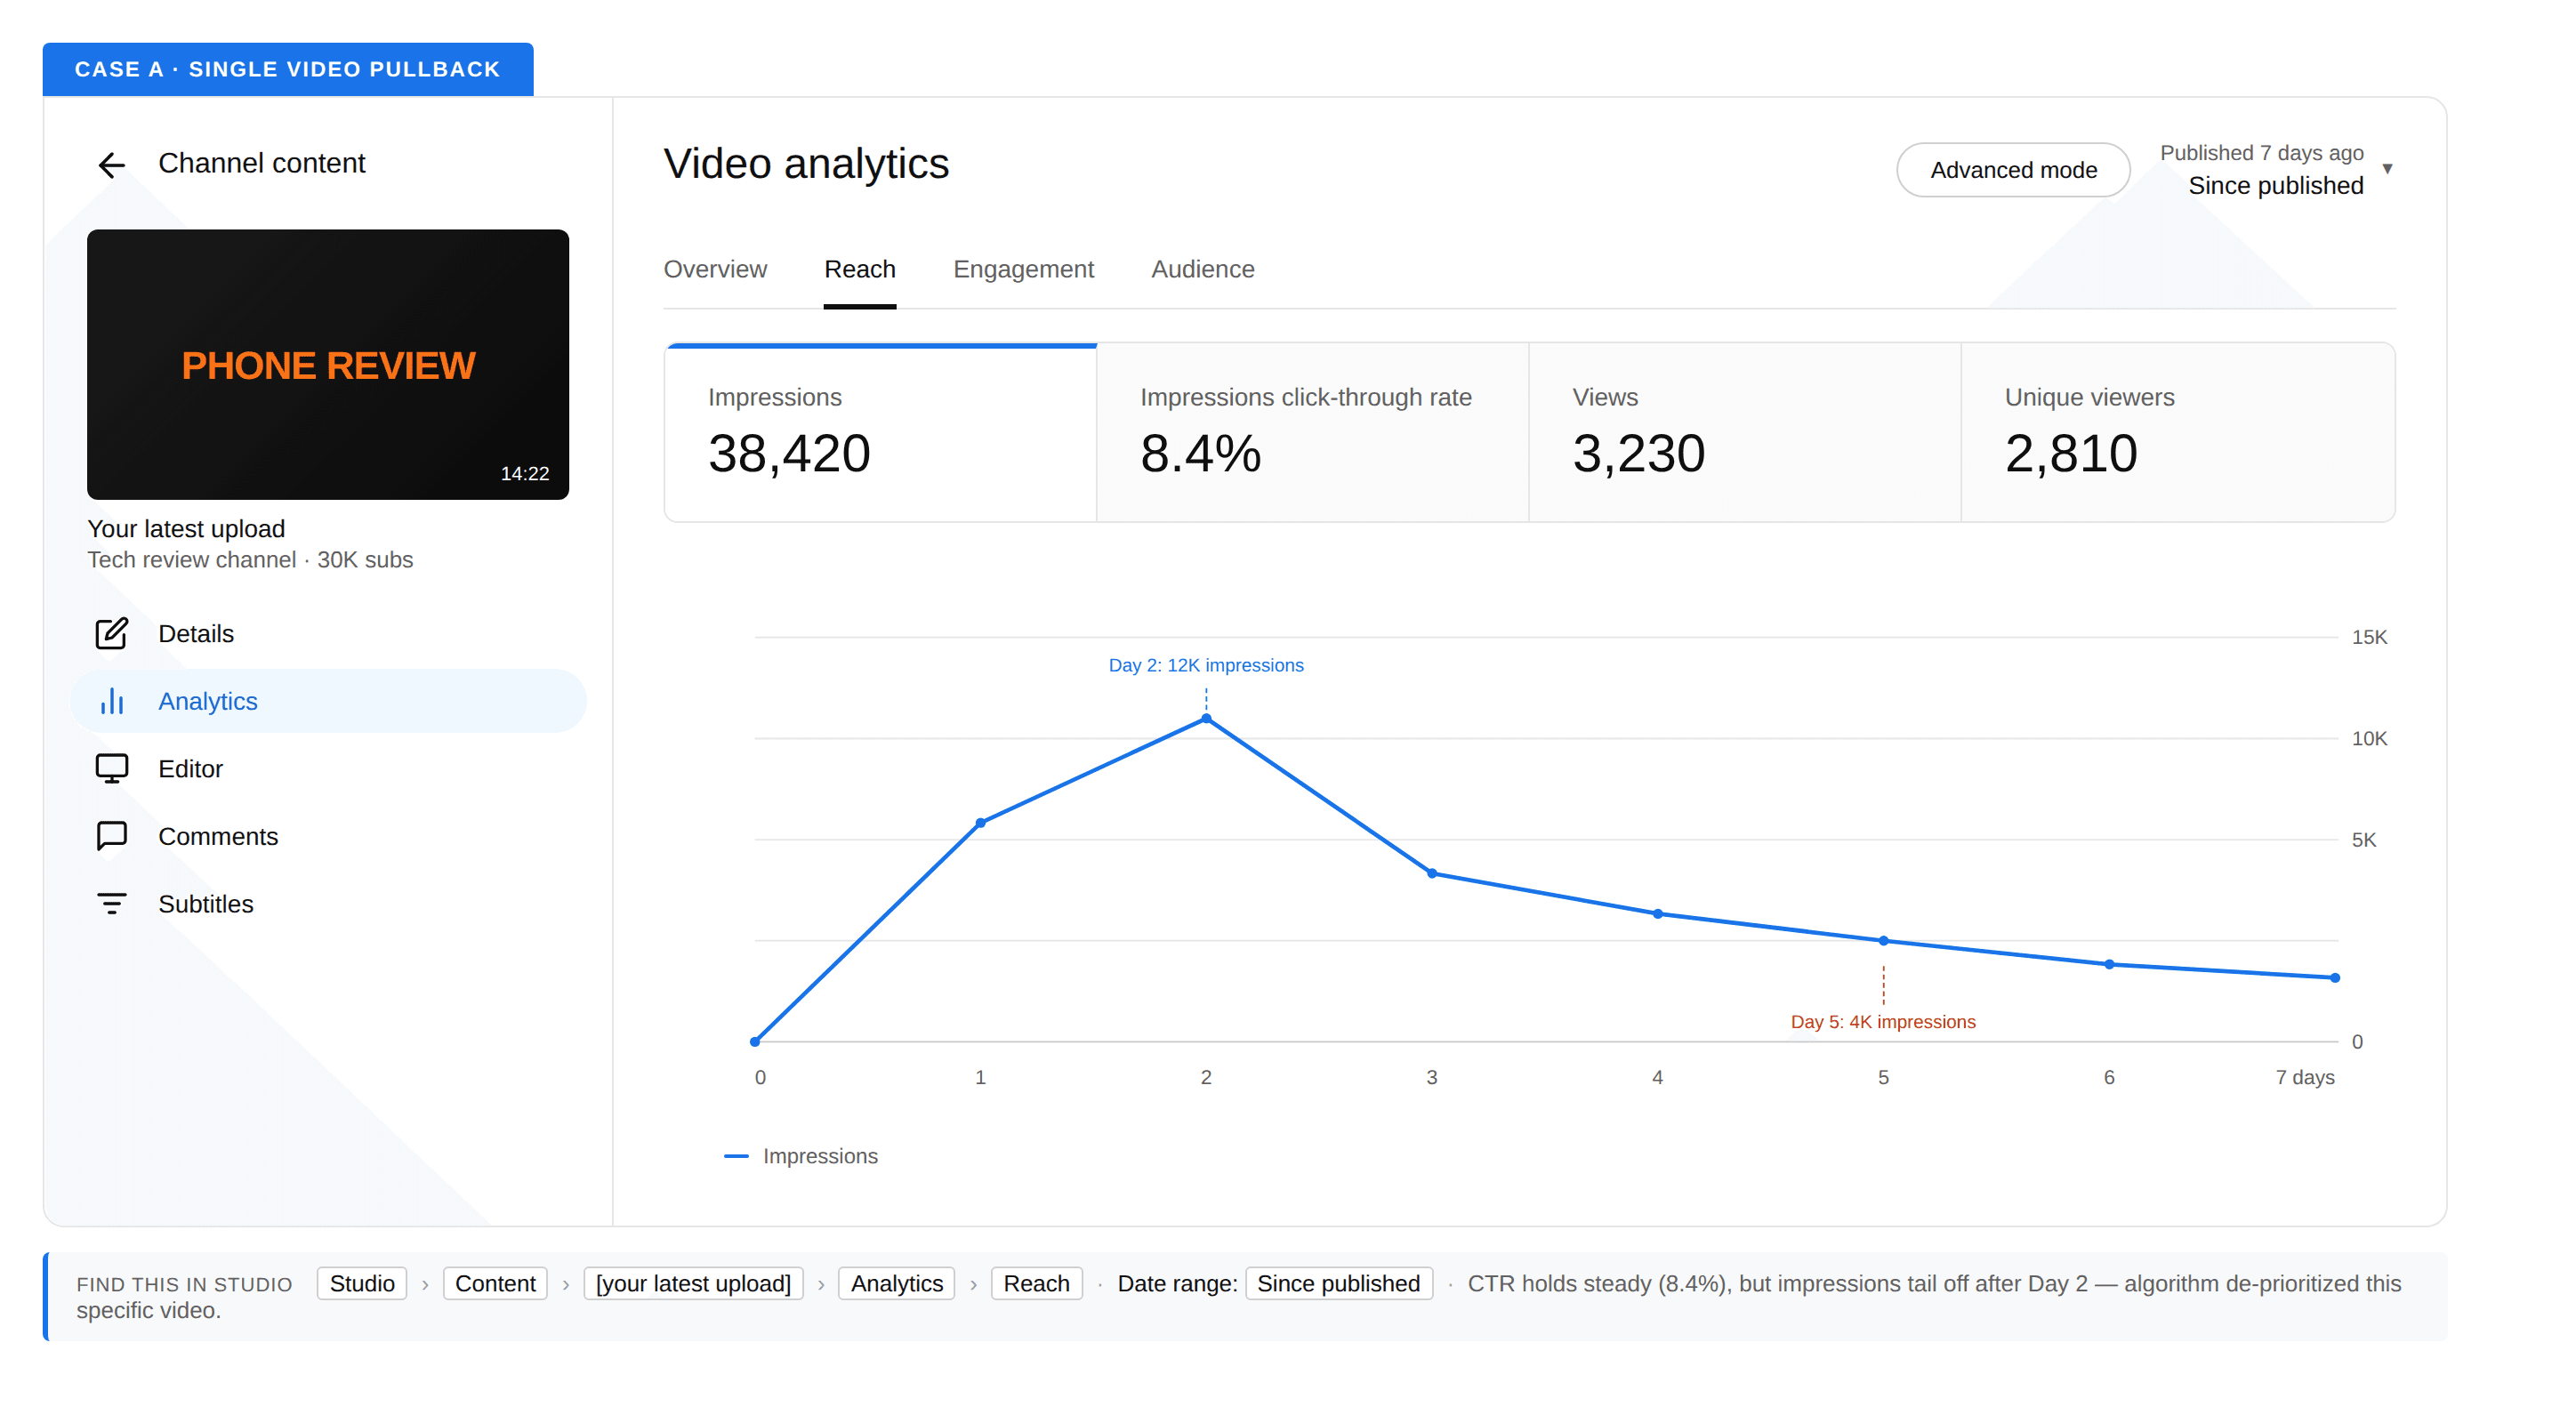
The algorithm specifically de-prioritized that title. Common when a video has a strong first 24 hours, then watch-time tapers in days 3–7 and the algorithm reduces the push. A tech-review channel at ~30K subs watched their last upload earn 12K impressions on day 2 and 4K on day 5, with CTR holding steady in the high single digits. Other recent uploads held their baseline. Single-video pullback.
The whole channel
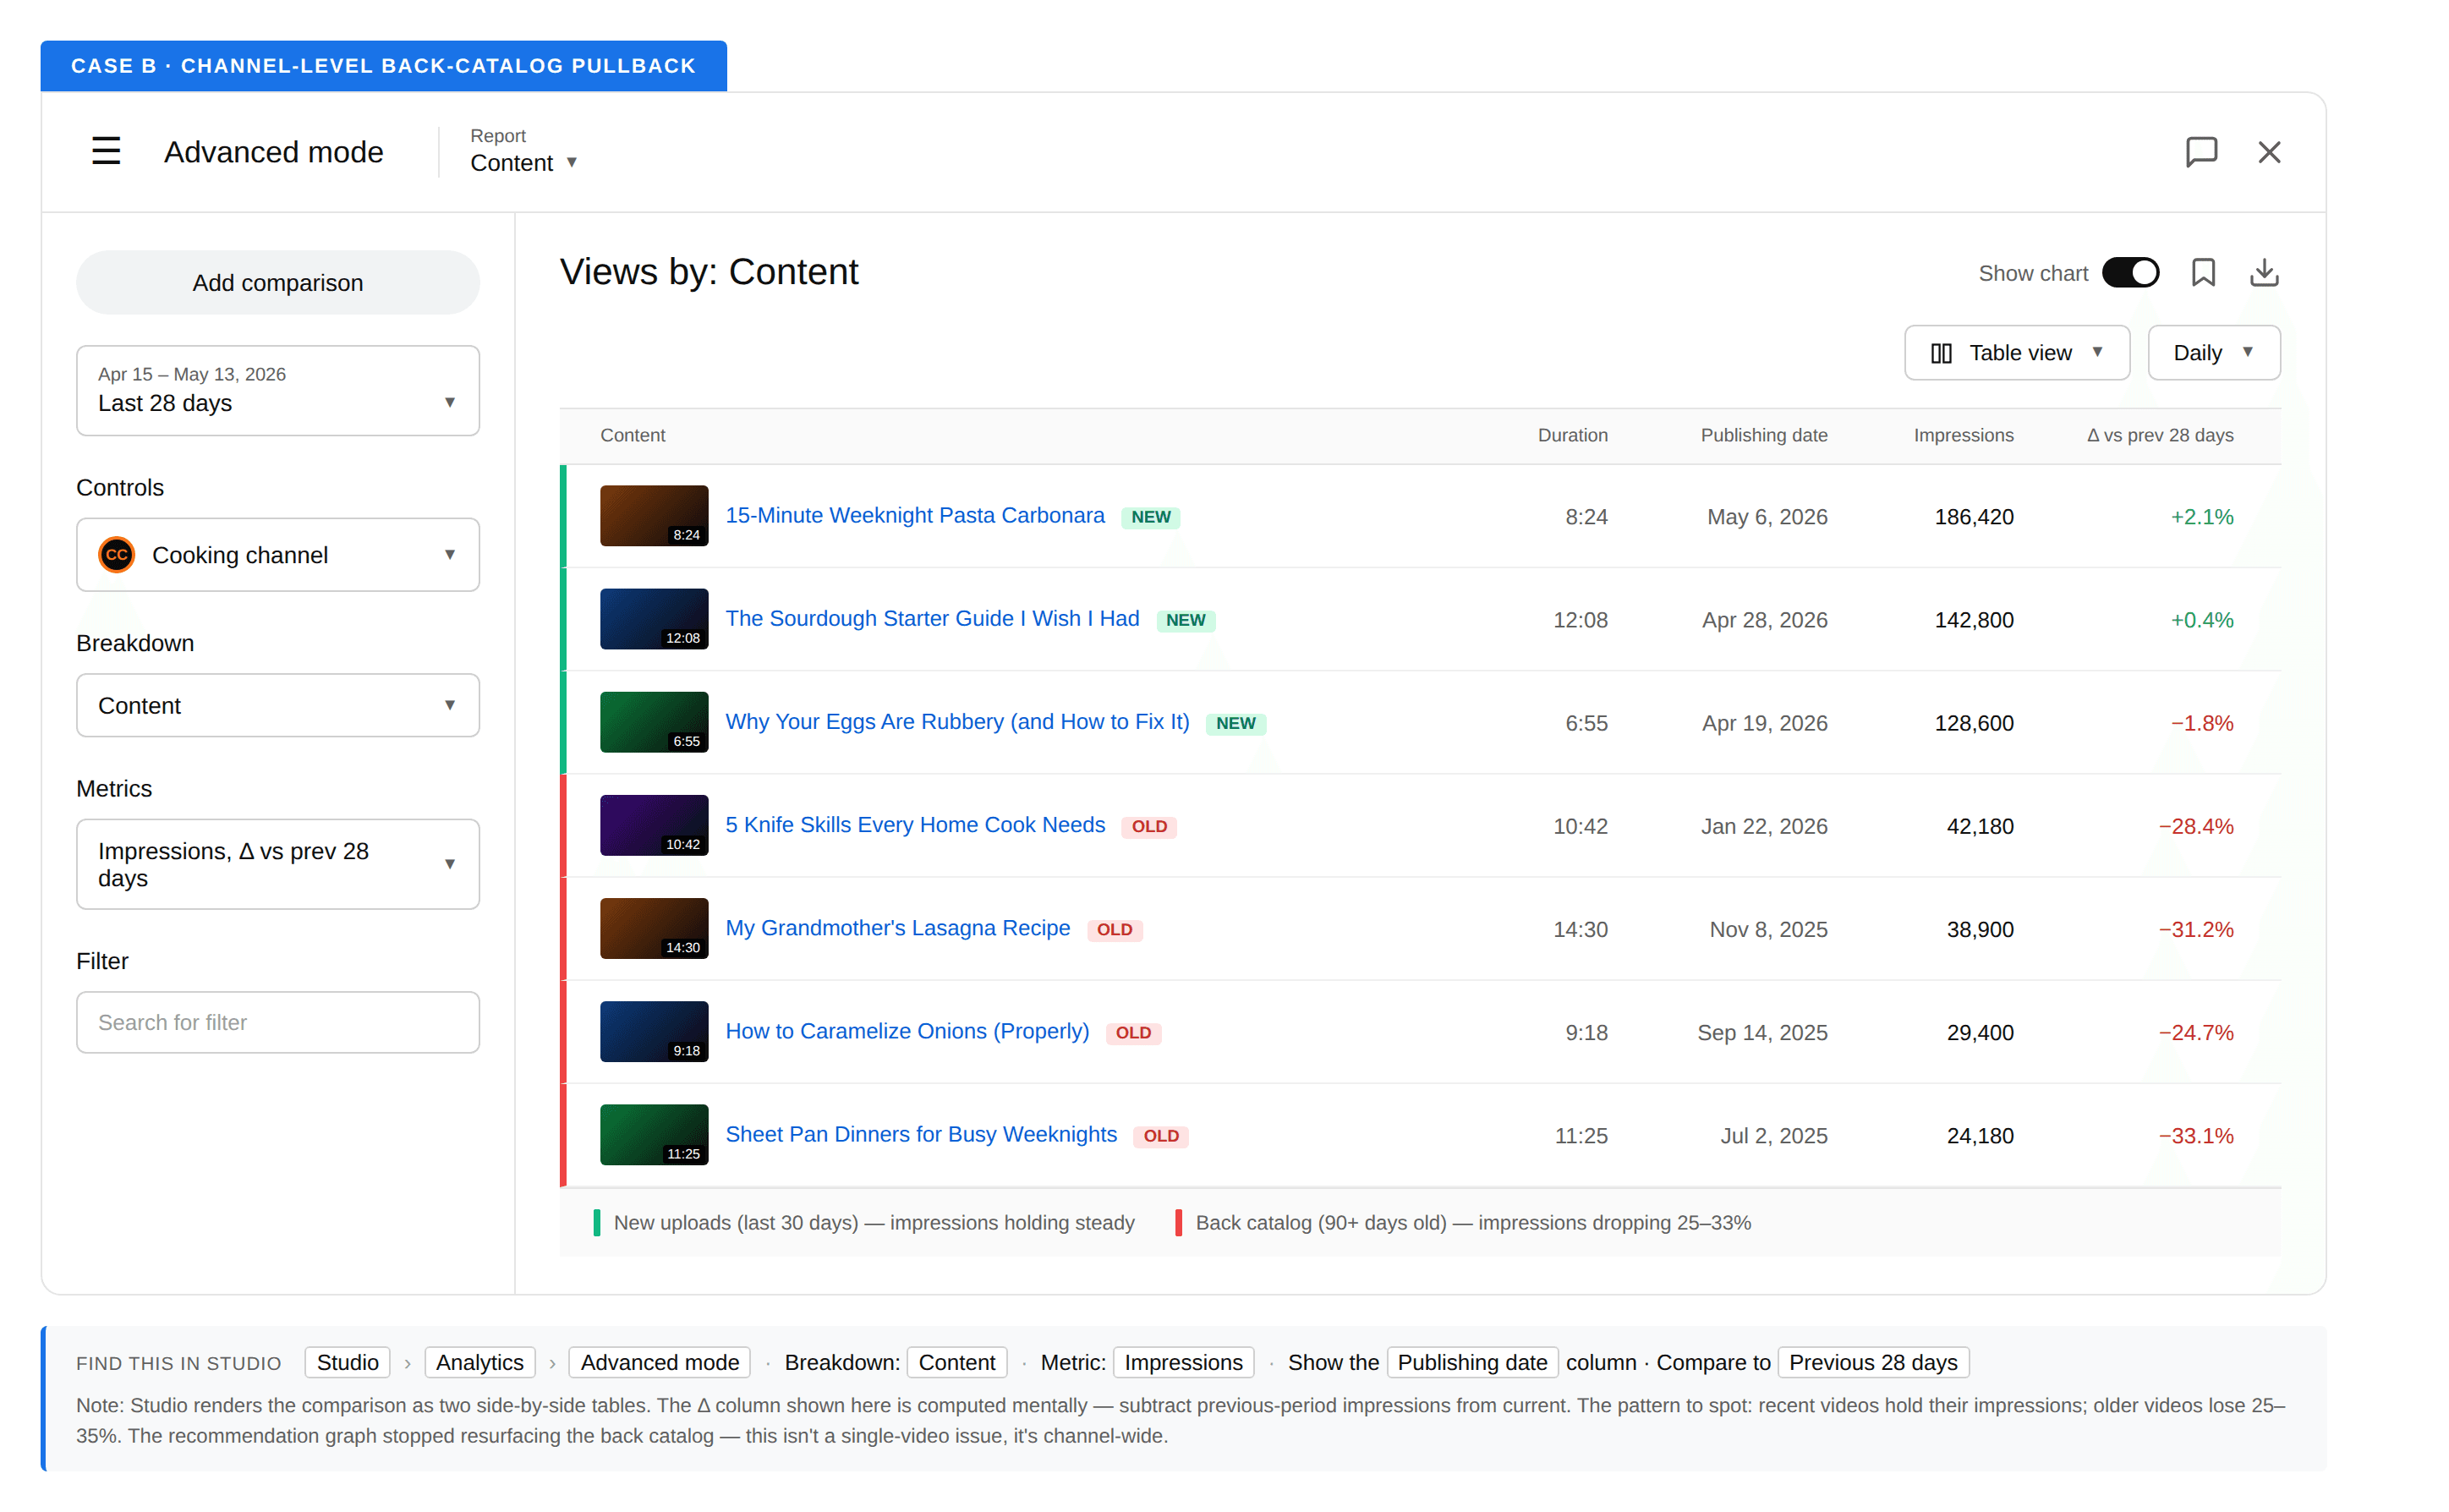
A channel-level signal changed: cadence drop, topic pivot, or a platform-level reshuffle. A cooking channel saw back-catalog impressions drop noticeably over two weeks while new uploads held steady. Same Pattern 1 signature, different cause — the recommendation graph stopped resurfacing older content. Don't fix this one video at a time. Fix the channel signal.
What NOT to do when CTR is fine
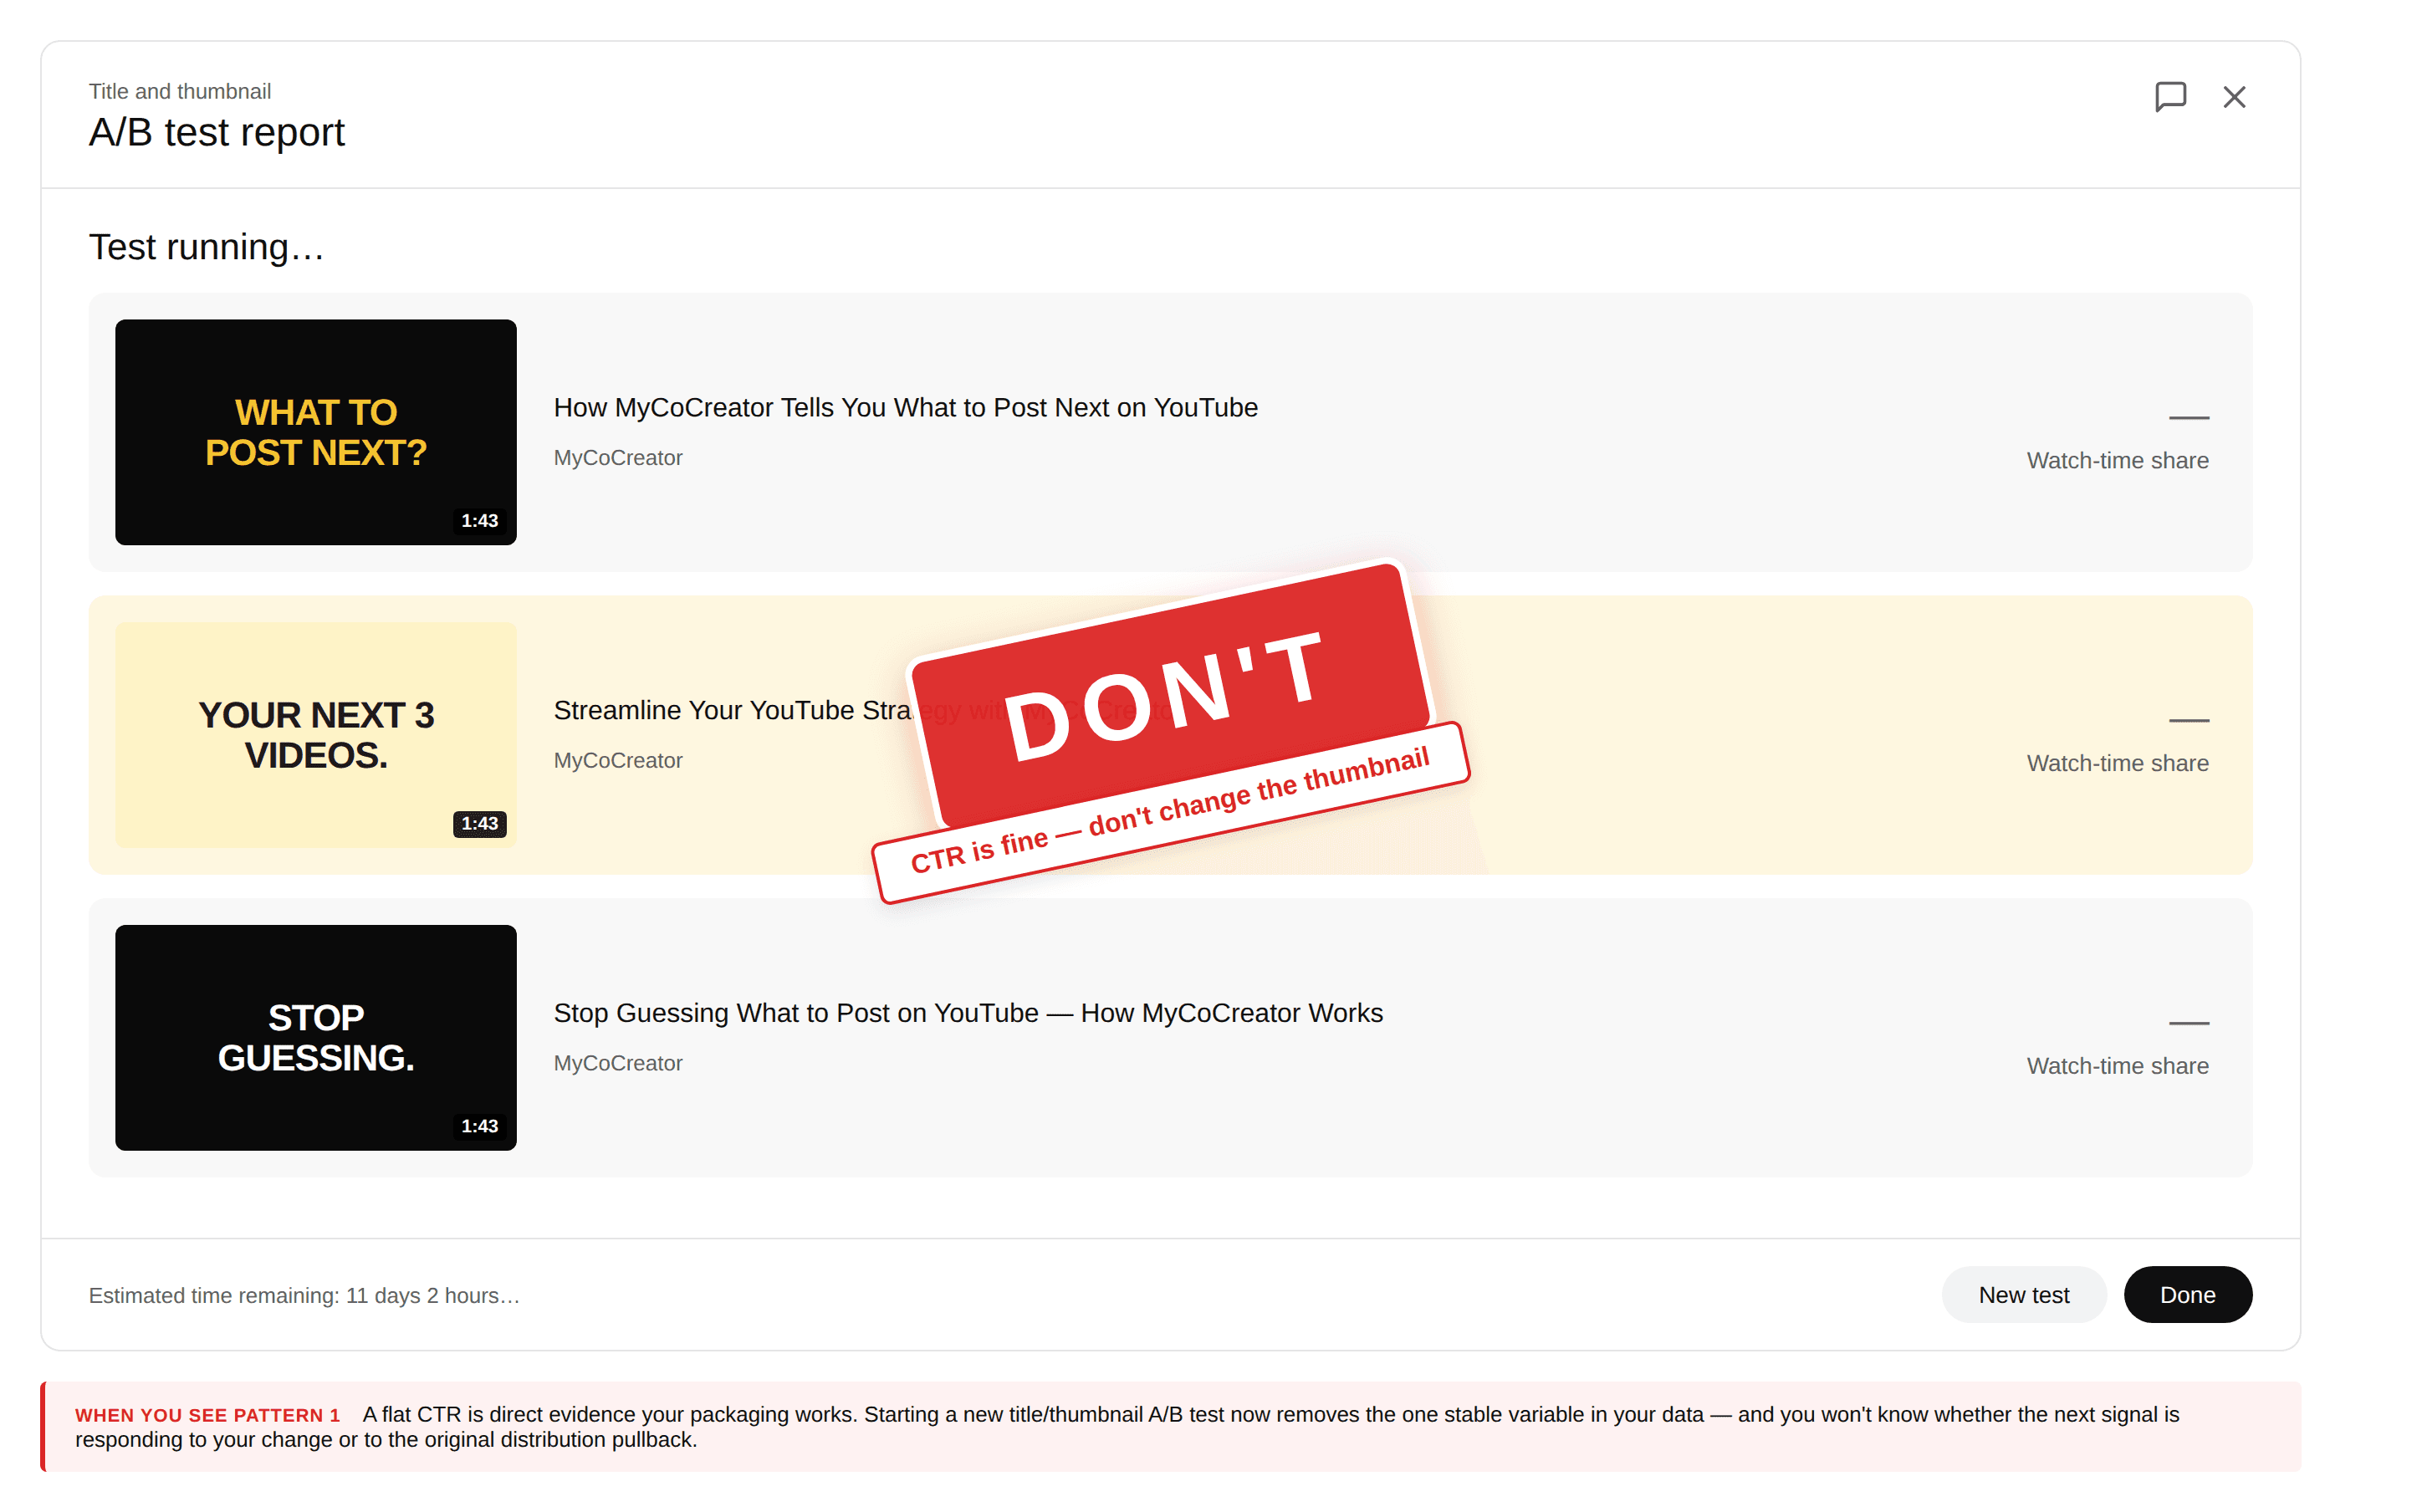
Don't redo the thumbnail
A flat CTR is direct evidence your packaging works. Change it now and you've lost the one stable variable in your data — you won't know whether the next round of numbers is responding to your change or to the underlying distribution shift.
Don't republish the video
YouTube treats a re-upload as a new video with no momentum and weaker search signal. You will almost always do worse.
Don't ask your community to "make it go viral"
It drags in viewers with mismatched intent, retention drops, and the algorithm pulls back further.
Don't pivot your next upload
A topic change during a soft window is the fastest way to confuse the recommendation graph.
What to actually try
Two moves, in order. Ship the next video on schedule, in the same recommendation neighborhood. Show the algorithm another data point in the lane it was already evaluating — a topic pivot here is the worst possible move. If two more videos show the same flat-CTR-low-impressions pattern, the pullback is structural. That's when it's worth investigating cadence, topic drift, or whether a competitor moved into your space.
Pattern 1 is the easy part to spot. The harder ongoing question — what's moving across your niche, where the opportunities are this week — takes more time. MyCoCreator is growth intelligence for that: niche and web tracked, weekly intel surfaced, so you skip the research.
Frequently asked questions
Why did my YouTube impressions drop but CTR is fine?
The signature means your packaging is working — the people YouTube did serve clicked at a normal rate — but the algorithm reduced how often it served the video. That's a distribution pullback, usually caused by weak day-1 watch time, a stronger competing video, audience saturation, or a platform ranking change.
Should I redo my thumbnail if impressions dropped but CTR didn't?
No. Flat CTR is direct evidence the thumbnail works. Changing it now eliminates the only stable variable in your data, and you lose the ability to read whether the next signal is responding to the change or to the original distribution shift.
How long does a YouTube impressions pullback usually last?
Most resolve within a week or two if the next upload performs. If two more videos show the same flat-CTR-with-low-impressions signature, the pullback is structural, not video-specific, and warrants a closer look at cadence, topic, or competition.
Does dropping impressions mean YouTube doesn't like my video?
Not exactly. It means YouTube's recommendation systems chose to surface the video to fewer people — usually because it didn't meet a watch-time threshold early. The fix isn't pleasing the algorithm; it's understanding which surface lost weight and why, then deciding whether to wait, ship next, or investigate channel signals.